

Are you a marketing manager or a data scientist and want to create clusters to improve your marketing campaign by engaging your clients in a different way? How would you define what clusters to create? The secret towards sustainable online retail rests on the ability to increase two KPIs: the DORO- Direct and Organic Recurrent Orders and the AOV (Average Order Value).
Phase 01 - Lets start with the DORO
You can calculate the DORO by applying numerous methodologies. You can use the LTV as an indicative of DORO. If the average DORO of a company is 4, that means in average after the first order, customers come back 4 times over the next 12 months through organic and direct traffic channels (without marketing acquisition spent). Besides margin and profit, the combination of DORO and AOV are the most valuable KPIs for a digital operations valuation.
How to calculate the DORO:
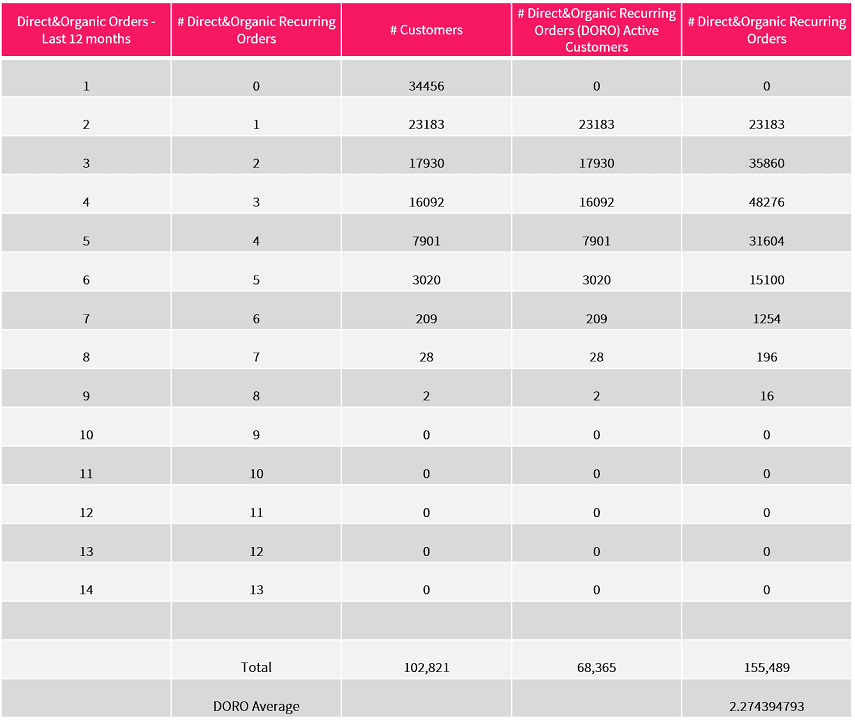
- Take your customer database and aggregate from the orders database a column that shows how many orders each customer made in the last 12 months when coming from organic or direct channels(A). Important: Only pick clients that made orders in the last 12 months. If a client made an order 12 months + 1 day ago, you should discard him;
- Create a new column (B) that shows the total quantity of orders minus one (A-1). You will end with a lot of customers with “0” (clients that bought once only - which from a recurring point of view aggregates to 0);
- Make the average of all customers that have 1 or more on column B, then you will get you DORO average number.
You might use the example below to guide you:
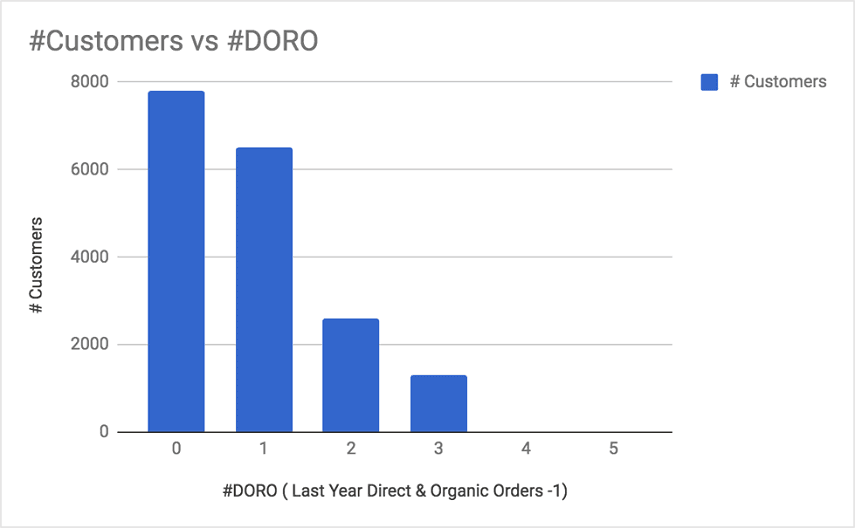
Now let's add a chart. Plot from 0 to the highest DORO value. Example:
- DORO 0 - 7800 customers
- DORO 1 - 6200 customers
- DORO 2 - 2190 customers
- DORO 3 - 1600 customers
- DORO 4 - 7 customers
- DORO 5 - 1 customers
You will expect a curve like the one below.
It is also good to check how many customers (%) you have below and above the average.
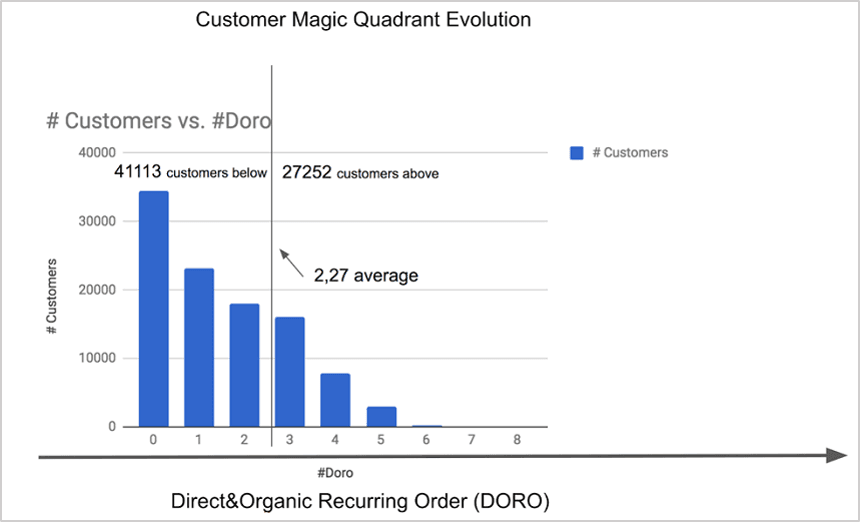
Phase one of the quadrant is done. Now, we have the vertical line of the quadrant. Let's go for the next dimension.
Phase 2 - Calculate the AOV
Would it be fair to treat your customers differently by only considering the DORO? Do loyal clients receive better customer care attention, better promotions, etc? Maybe not. Imagine you have Customer A with DORO 11 (meaning they made one order per month) and Average Order Value of $20.00 and Customer B with the same DORO 11 and $80.00 as AOV. It is obvious that you cannot engage them with the same approach. So let's create the second dimension of the chart.
How to calculate the Average Order Value:
- Take your customer database and aggregate from the orders database a column that shows the average basket for each customer (B). Important: Only pick clients that made orders in the last 12 months. If a client made order 12 months + 1 day months ago you should discard him.
- Make the average of all customers, then you will get your AOV (e.g. AOV = $45.00).
Now, plot on the vertical line all the customer's average order values grouped by ranges of AOV. Draw 9 horizontal lines from zero to your max Average Order Value (e.g. Min AOV as 40-> $50, $50->$60, so on, until ->120 max value). Note that the range value should be with the same gradient (like a simple analytical projection). To do this, you can easily pick your max average data (e.g. 120 max value) minus the min average data (e.g. 40 max value) always good to discard .5% outliers - and divided by 8, and then you will define the first range edge:
e.g. $120 / 8 = $100 - this is your range gap Draw on the chart the gap lines.
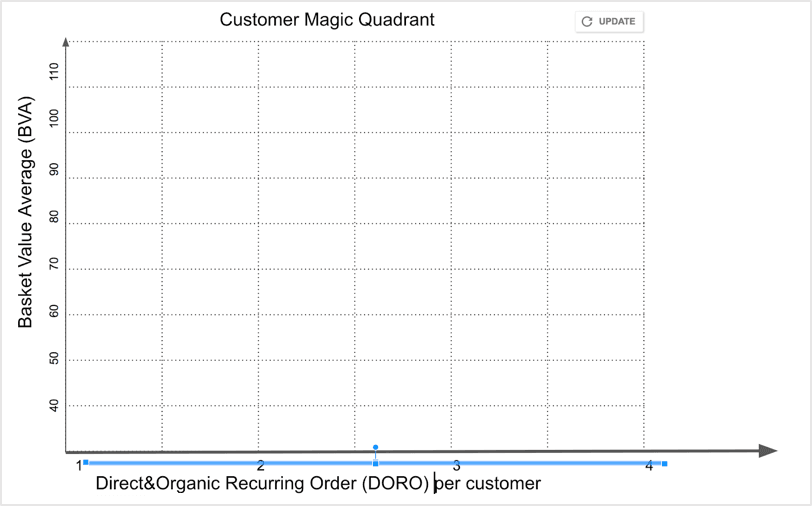
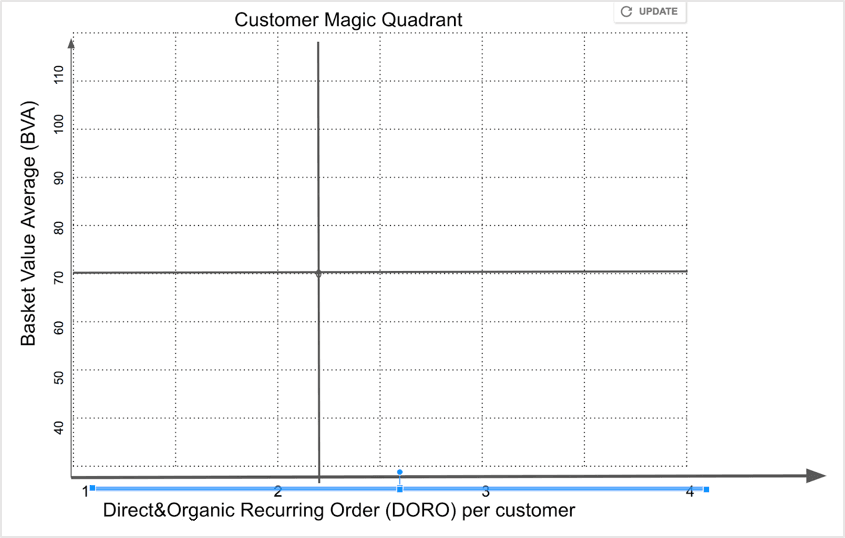
Highlight the DORO average and draw a vertical line.
Also highlight the AOV median and trace a horizontal line on that.
Why the median? The magic quadrant is an engagement tool so we need to distribute the customers in a way that we can avoid wrong interpretation. Mediana gives you 50% of customers in each side of the quadrant. This will create a better distributed chart.
Now it is where the magic appears! You will have something like this.
Let's put now the numbers of customers in each quadrant.
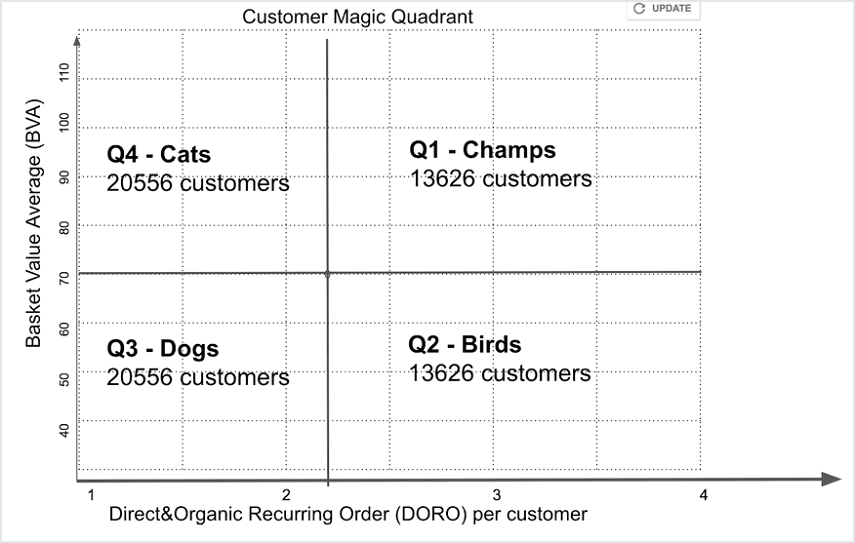
The CMQ defines four groups that you can engage in a different way. The customers in this quadrant are the creme de la creme asset of your company.
Remember: For the Customer to be here in the quadrant means that he buys only through Direct or Organic channels and buys more than once a year. So all the groups are highly valuable.
- Q1 defines your best customers (the ones that are loyal and buy high values) - let's call them “Champs”
- Q2 defines the ones with high organic recurrence rate but small sized baskets, let's call them “Birds”
- Q3 defines the ones with lower organic recurrence and lower basket size, let's call them “Dogs”
- Q4 defines the ones with lower organic recurrence but with big basket size, let's call them "Cats"
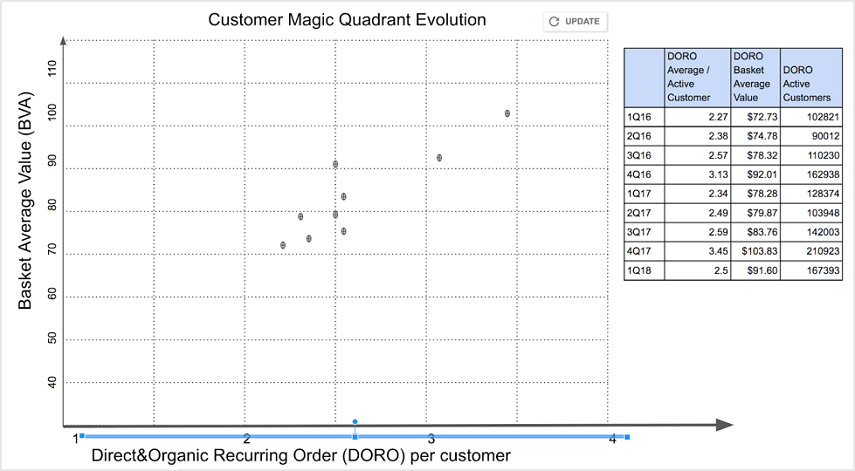
Customer Magic Quadrant - evolution analysis
To facilitate the understanding of your company's evolution, you can check the CMQ every quarter populating the data as a planet in the space and comparing the median from AOV and DORO you will be able to really understand if your company is evolving or not.
Pick the DORO average and the AOV median per quarter and plot it in the same chart.
Then you can draw a line linking the dots of the same year and you will see clearly if your company is evolving or not in the Customer Magic Quadrant.
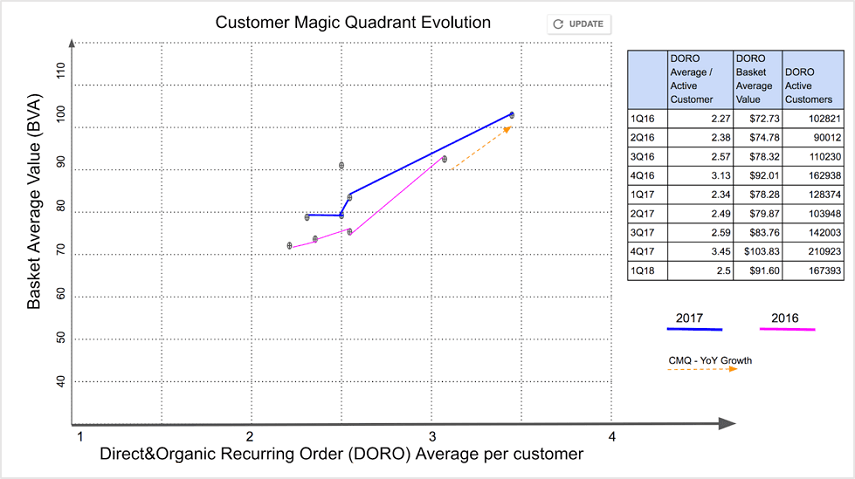
These evolution lines might be a very good indicator or even be correlated curve with the companies valuation curve.
Conclusions
This article's objective is to drive your attention to the two main KPI's of a digital commerce company. Retailers used to manage the organization by antique parameters. The DORO average and the AOV median combined gives you a sense of what your company represents in the minds and share of wallet you detain of your customers.
By design, this article is ignoring the customer's data that comes from paid traffic. This data is as important as the direct and organic data, but naturally, it should be part of the daily analysis of the company. By embracing the DORO KPI, you are giving your company a chance to really play as a brand in the digital market. Brands that value customers with a pure loyalty relation.
f your DORO and AOV numbers are good that means that you really are a customer-centric company. If your numbers are not so good, that shows you are more a product-centric company with "buying revenue" strategy. This is not sustainable. To be in your customer's minds and improve your share in their 'wallet share' is the only way to thrive in the digital commerce market.
